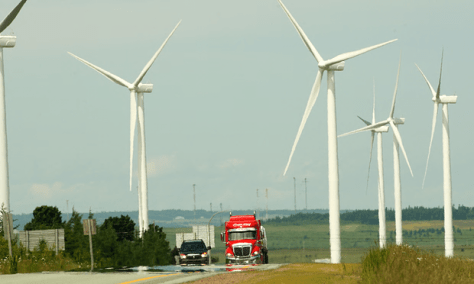
Today, November 2/17 marks the one year anniversary the Niagara Region Wind Farm (NRWF) joined the Ontario Grid with production.
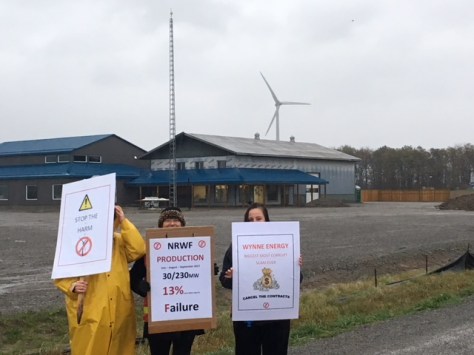
In acknowledgement of this date a few of us took to the corner of Elcho Rd & Road #27, the new location of an Enercon facility, to express our varied concerns.
Enercon Facility for Niagara Wind
At this point we were being pelted with rain for just over an hour and soaked from muddy road spray from passing trucks and vehicles. Worth every minute! Thank you ladies!!!
Tim Horton’s coffee shop & dialogue about the impacts of industrial wind turbines
A vibrant, informed and concerned citizen, Catherine Mitchell, schooling the local gents at the nearby Tim Hortons. She had them engaged and they asked wonderful questions.
Way to go Catherine!!!
In times of greatest need it is always wise to know whom you can call on. The same applies to the electricity system and it is rather telling what was produced by each generator type in our hour of greatest need. The ‘Peak Demand’ for electricity in 2017 in Ontario occurred on September 25, 2017 at 5:00 PM.
Ontario can produce power from nuclear, natural gas, hydro, wind, solar and biofuel energy generators and the Independent Electricity System Operator (IESO) is responsible for the management of the resources in the system. The following chart looks at production from each fuel type during the peak demand at 5:00 PM Sept 25, 2017 to determine the adequacy of resources to meet the demand.
IESO report – 18 Month Outlook: An Assessment of the Reliability and Operability of the Ontario Electricity System from October 2017 to March 2019: http://www.ieso.ca/en/sector-participants/planning-and-forecasting/18-month-outlookPage 17 -Table 4.1 provides (A) total installed capacity and the (B) forecast capability @ outlook peak.
To keep the lights on, refrigerators running and industry rolling in our hour of greatest need on September 25, 2017 at 5:00 PM we needed 21,786 MW of power. The Ontario power generators produced 20,345 MW of power and we imported 1,441 MW from Manitoba and Quebec. (It seems like natural gas generators could have been ramped up an additional 1,500 MW per hour without exceeding the IESO forecast capability at peak, but we imported power instead.)
Nuclear, one of the baseload generators for Ontario, did most of the heavy lifting and came through producing 9690 MW of power or 48% of the power produced in Ontario. This is higher than the average yearly production of 7548 MW/hr but less than the maximum capability of the nuclear plants.
Hydro – our baseload renewable energy source – produced 5135 MW of power from a potential of 5786 MW. So we were using 89% of the potential production from our cleanest, greenest, cheapest energy source. The average hourly demand from hydro is 3207 MW/hr and generally we spill water over the dams and waste that renewable energy resource. But in our hour of greatest need hydro provided 25% of the power produced in Ontario.
Natural gas, another baseload power generator that can be quickly ramped up or down, provided 5268 MW of power in our hour of greatest need. Natural gas is definitely our BFF (best friend forever). According to the IESO gas plants are capable of producing 8,371 MW of power each hour, yet on average the natural gas plants produce 417 MW of power each hour. From January – August 2017 the gas plants operated at 4.9 % of their potential!! This means that they are being underutilized and sit idle the majority of the time. But on September 25 at 5:00 PM the gas plants provided 26% of the power produced in Ontario.
And then we get to the contribution of the energy of the future – wind and solar!
The total installed nameplate capacity of all the industrial wind turbines in Ontario is 4213 MW. So the IWT’s should have made a significant contribution. But in our hour of greatest need the total power produced from all the IWT’s installed in Ontario was 67 MW!!! This represents a total contribution of 0.3% of the power produced in Ontario. Power that was required to keep the lights on, the refrigerators running and the industry rolling. Solar made a bigger contribution of 85 MW or 0.4% of the power produced in Ontario.
To understand the limits of wind power, the late Glenn R. Schleede, formerly Vice President of New England Electric System, Executive Associate Director of the U.S. Office of Management and Budget, Senior VP of the National Coal Association in Washington and Associate Director (Energy and Science) of the White House Domestic Council says it best: “Wind turbines have little or no ‘capacity value’ because they are unlikely to be producing electricity at the time of peak electricity demand. Therefore, wind turbines cannot substitute for conventional generating capacity responsible for providing reliable electricity to customers.”
According to Schleede, the true capacity value of a wind turbine or ‘wind farm’ is generally less than 10% of nameplate capacity and often 0% or slightly above — simply because, at the time of peak electricity demand, the wind isn’t blowing at a speed that will permit the turbine to produce any or much electricity. Claims of wind turbine capacity value have been exaggerated by wind industry officials and lobbyists, and by regulatory agencies. As we are finding out in Ontario – industrial wind turbines generate a minimal amount of electricity.
Wind and solar are both intermittent so we can not ramp them up or even depend on them for power because they only produce power when the wind is blowing or the sun is shining.
Wind and solar certainly let us down in our hour of greatest need!
A Rally and Town Hall Meeting to demand the cancellation of wpd Canada’s White Pines Wind Project in South Marysburgh
Sunday, October 15th in Picton
March (rain or shine):
1:00 p.m. to 2:00 p.m. down Main Street, Picton. Assemble on Cold Storage Road in Picton by 12:30 p.m. and bring along your personalized sign, placard or poster.
Meeting:
2:00 p.m. to 4:00 p.m. at the Regent Theatre
Learn how the 9-turbine White Pines Wind Project WILL affect you and Prince Edward County, and what you can do to help. Local politicians, County residents, business people and experts will provide impact statements, updates, and answer your questions about: loss of landowner and municipal rights because of the Green Energy Act; human health effects; destruction of heritage, tourism and endangered species; and other concerns.
Speakers:
Mayor Robert Quaiff; MPP Todd Smith; Winemaker Norman Hardie; Wind Concerns Ontario President, Jane Wilson; Dr. Robert McMurtry OC; and other knowledgeable individuals. Moderated by Councillor Steve Ferguson
Contact logistics coordinator Les Stanfield at 613.476.5363 or Contact Councillor Steve Ferguson at 613.827.7174 or sferguson@pecounty.on.ca
The Alliance to Protect Prince Edward County (APPEC) has commenced legal proceedings naming the Independent Electricity System Operator (IESO) and WPD White Pines Wind Inc. (WPD) as respondents. APPEC alleges that the Feed-In-Tariff (FIT) contract between the IESO and WPD should have been terminated as soon as it became evident that WPD would be unable or incapable of fulfilling the FIT contract terms. These FIT contract terms have been made publicly available and are well known.
In 2010, a FIT contract for 60MW wind energy project to be operational within three (3) years was offered by the Ontario Power Authority (now the IESO) to WPD. The contract allowed for termination if the project was not able to deliver at least 75% of the contracted power. A Renewable Energy Approval (REA) was granted to WPD by the Ministry of the Environment and Climate Change (MOECC) five years later in 2015. Immediately after the MOECC approval, an appeal was made by APPEC to the Environmental Review Tribunal (ERT). In 2016 the ERT found that the project would cause serious and irreversible harm to the natural environment. After allowing the proponent an opportunity to propose additional mitigation measures to prevent this harm, the ERT still found it necessary to remove 18 of the 27 wind turbines from the project. As a result, the project is only permitted to erect nine (9) 2.05 MW turbines which can only fulfill approximately 30% of the original FIT contract requirement, far less than the 75% referred to under the contract.
APPEC has made an application to the Ontario Superior Court of Justice seeking a declaration that the FIT contract for the White Pines Wind Project is null and void and an injunction on any further work on the White Pines Wind project. A hearing on this matter is currently scheduled for November 17th, 2017 at 44 Union Street, Picton, Ontario K0K 2T0 at 10:00 a.m.
The blowout of wind and solar in the Ontario Electricity System is revealed by production levels that are well below the rated installed capacity.
Ontario can produce power from nuclear, natural gas, hydro, wind, solar and biofuel energy generators. The results are recorded in many ways but the three used here are (A) the total installed capacity of each generator type (what was installed), (B) the forecast capability at outlook peak (what can be produced) and finally the (C) generator output by fuel type for 2017 (production).
According to the IESO report – 18 Month Outlook: An Assessment of the Reliability and Operability of the Ontario Electricity System from October 2017 to March 2019 – (http://www.ieso.ca/en/sector-participants/planning-and-forecasting/18-month-outlook ) Page 17 – Table 4.1 provides (A) total installed capacity and the (B) forecast capability @ outlook peak
It is neither possible nor desirable to run the electricity system flat out and some redundancy needs to be built into the system for maintenance and emergencies. The total installed capacity of all fuel types reported is 36,853 MW, but at peak demand the system is capable of producing 26,704 MW of power each hour. The total production that IESO counts on at peak demand is 26,704 / 36,853 = 72% of the energy system potential.
The second column provides the Forecast Capability at Outlook Peak and takes into account deratings, planned outages and “allowances for capability levels below rated installed capacity”. When you compare the installed nameplate capacity for wind and solar with the actual production there is an 80 to 90 % drop in production over nameplate capacity!
The total output for all fuel types (column C) for Jan – Aug 31, 2017 is available on the IESO website – ‘Generator Output by Fuel Type Monthly Report 2017’. The total output from Jan – Aug was 12,023 MW of power produced each hour. According to the IESO the forecast capability of the existing generator stations at outlook peak is 26,704 MW of power each hour. The production from the electricity system was 12,023/26,704 = 45% of the capability. So why did we agree to purchase power from Quebec?
The renewables – wind and solar are intermittent power sources and require back-up power. Natural gas was the choice made for Ontario. Natural gas is a responsive base load fuel that can be ramped up or down quickly. Nineteen natural gas plants have been commissioned in Ontario since 2003. According to the IESO they are capable of producing 8,371 MW of power each hour, yet the natural gas plants only produced 416.7 MW of power each hour from Jan – Aug. We have gas plants operating at 4.9 % of their potential!! This means that they are being under utilized and sit idle the majority of the time. The private for profit corporate owners are not running a charity so the Ontario ratepayers are paying millions of dollars each month to gas plants paid not to produce power.
Wind and solar on the other hand blew out. They were only able to produce 13.2 to 18% of their nameplate capacity. The production from wind for Jan – Aug 31 was 764 MW per hour from a name plate capacity of 4,213 MW. A dismal performance with 18% production from the installed nameplate capacity. According to the IESO the forecast capability for wind at peak demand is 533 MW or 12.7% of the installed capacity. The difference is explained as an “allowance for capability levels below rated installed capacity.” No kidding – considerable distortion exists in the presentation of material when a product has an 80% drop in production over the stated manufacturer nameplate capacity. This is like telling me that my new car is capable of 1000 km on a tank of gasoline and instead it goes 200 km!
According to the IESO the monthly wind capacity contribution values range from 12.6% to 37.8% of the installed capacity (18 – Month Outlook p.19). So the nameplate capacity of an industrial wind turbine is somewhat arbitrary.
To understand the limits of wind power, Glen Schleede explains it best. “Wind turbines have little or no ‘capacity value’ because they are unlikely to be producing electricity at the time of peak electricity demand. Therefore, wind turbines cannot substitute for conventional generating capacity responsible for providing reliable electricity to customers.
Second, a kilowatt-hour (kWh) of electricity from wind has less value than a kWh of electricity from a reliable (dispatchable) generating unit providing base load power – nuclear, natural gas or hydro which can produce electricity whenever the electricity is needed.
These issues are important because “wind farm” developers and lobbyists have misled the public, media and government officials by making false claims and by using terms intended to confuse their listeners
The true capacity value of a wind turbine or ‘wind farm’ is generally less than 10% of nameplate capacity and often 0% or slightly above — simply because, at the time of peak electricity demand, the wind isn’t blowing at a speed that will permit the turbine to produce any or much electricity. Claims of wind turbine capacity value have been exaggerated by wind industry officials and lobbyists, by regulatory agencies”, and as we are finding out in Ontario industrial wind turbines generate a minimal amount of electricity.
The IESO hourly wind generator output 2006 – the present provides data on every industrial wind facility in Ontario. If we use the West Lincoln NRWF industrial wind facility as an example we find that the facility is rated at 230 MW nameplated capacities. On average the facility produced less than 27 MW per hour during July, Aug and Sept of 2017, when electricity is generally at its greatest demand. The production was 11.7% of the name plated capacity! It never once reached its nameplate capacity of 230 MW and it only went above 200 MW for 20 hours in the last three months.
Hydro – a baseload renewable energy source – produced 3242 MW of power per hour from Jan – July from a potential of 5,786 MW. So we are only using 56% of the potential production from our cleanest, greenest, cheapest energy source. The sad reality for the ratepayers of Ontario is that the hydro plants could easily have been ramped up an additional 850 MW per hour to cover the contribution of wind and solar. Instead we ran the water over the dam.
Using nameplate capacity creates a false sense of the ability of renewables – wind and solar – to provide power. Wind and solar are both intermittent so we can not ramp them up or even depend on them for power because they only produce power when the wind is blowing or the sun is shining.
Consumers know they want the lights kept on, the refrigerator running and the industry rolling. But it is difficult for consumers to make informed decisions about the success or failure of a program when information is presented in such a convoluted manner. The renewable energy initiative in Ontario was a political decision. According to several reports from the Auditor General the Ontario government did not conduct a cost benefit analysis. To continue installing a power system that can not provide power on demand to cover up a bad decision will eventually lead to failure of the total electricity system and will be considered an act of betrayal by the ratepayers that are responsible for the bill.
To accommodate the wind industry, we are paying for hydro power generators to run inefficiently; we are paying for power generators not to produce; we are entering into contracts to purchase power when we are awash with over production and with the “Fair Hydro Plan” we are downloading $20 to $40 billion of debt onto our children and grandchildren.
Renewable energy sources are a cautionary tale. The article “600 sheep maintain the grounds around solar project” by Diana Martin in the August 1, 2017 (Ontario Farmer) paper provided much insight into the Samsung Southgate Solar project, but much was left unsaid.
The Samsung Southgate Solar Project went on line in December 2016. The nameplate capability is 50 MW of solar energy produced from 192,160 solar panels. Technically the potential production should be 50 MW of energy produced each hour, but when you look on the Independent Electricity System Operator (IESO) website – reports.ieso.ca/public/GenOutput you find that solar projects only produce energy when the sun shines so production is zero for ten hours per day.
The total days production from the Samsung Southgate Solar Project on August 17, 2017 was 90 MW or 3.75 MW per hour! According to IESO Ontario requires an average of 22,493 MW of energy produced each hour to keep the lights on, the refrigerators running and the industry rolling. The demand on Aug 18 at 8:00 AM was 16,810 MW of power.
If we consider the contribution of the Samsung Southgate Solar project to the total energy required 3.75/16810 = 0.02 % of the production required. So we would require 4,482 solar projects of this size to provide the power the province needs. Of course since no solar energy is produced at night and production decreases when the sun is not shining we would have to rely on natural gas or nuclear or hydro – the baseload power generators of the province – to provide the power needed. Actually we would be relying on baseload power for 99.98% of the power required.
This solar project required 350 acres of farm land so 350 X 4482 projects = 1,568,700 acres of farm land would be required to produce intermittent energy rather than food for the people. The production of solar panels requires silicon solar cells, typically an aluminum frame, glass sheets, copper wire and plexiglass. Additionally, solar panels contain heavy metals such as cadmium, lead and rare earth elements such as gallium and indium. So the production of a solar panel is not really “green” and should have a C02 tax on the production side. The panels require a complex recycling mechanical and thermal treatment process. In Europe the EU dictates solar panel disposal guidelines in the waste of electrical and electronic equipment directive, but no such guidelines exist in Canada. We are not preparing for large quantities of photovoltaic solar waste. The panels may have salvage value but the process is not ‘green’. So we have a CO2 cost on the production side and a CO2 cost on the disposal side. The cradle to grave CO2 costs in the mining of components, manufacturing of parts, transportation, installation, maintenance and decommissioning all has to be calculated to get the true CO2 cost. Is a 10 year life span enough to create a positive CO2 balance in the use of solar panels?
According to Don Lewis in the Aug 1, 2017 article the contract for the solar park is for 25 years and several change outs of solar panels are expected. In fact a number of European solar farms have switched out their panels twice in the last decade! So if the 192,160 panels are switched out 3 times in the 25 years we have 576,480 – over half a million – panels on their way to a toxic waste dump.
The cost of solar panels has gone down from $750 to $220 per panel but paying to change out over half a million panels will add $127 million to the maintenance costs of this project. Sure makes me wonder how much Ontario ratepayers are paying for the energy produced from this project!
Mr Lewis claims that the project is a “win-win” situation for him. He is paid rent for his land from Samsung and his sheep are grazing in the enclosure. My thinking is that the ratepayers of Ontario energy have been tossed to the coyotes that pace the fence.
The global adjustment charge is chiefly used to cover the difference between the province’s market price for power and the price guaranteed to hydroelectric, natural gas, nuclear, solar and wind generators through their regulated payments or contracts with the government, as well as the cost of conservation programs. All electricity customers in Ontario pay global adjustment, which can be a separate line or included in the commodity portion of their bill.
But the August lawsuit filed by National Steel Car (NSC) believes the revenue the IESO collects for the global adjustment, from the company “and others,” should be declared “an unconstitutional tax, not a valid regulatory charge.”
The company gives numerous reasons, including that the global adjustment allegedly “redistributes wealth from the consumers of electricity in Ontario to, among others, the generators of renewable electricity.”
Manufacturer launches challenge against power fee that has cost Ontarians billions
The lawsuit argues that the global adjustment fee is an unconstitutional tax imposed to fund the Ontario government’s policy initiatives
To the very end…
“It will be expensive. And it’ll be expensive when I win my suit in Ottawa because that will make all of the IWT’s illegal, they’ll all have to come down, and somebody’s going to have to pay the bill.”
– Alan Whiteley re: Ontario’s “Fair Hydro Plan”
Alan Whiteley presentation to the committee on Ontario’s Fair Hydro Plan links the government’s response to escalating electricity rates and harsh decisions people are forced to make in the face of energy poverty. Ontario is taken to task over to its failure to assess costs ,benefits and adverse consequences of its renewable energy policies.
Alan Whiteley is the legal lead for the Judicial Review before the Courts of Ontario’s Green Energy Act (GEA). The challenge is predicted to be successful and would result in making all erected Industrial Wind Turbines in Ontario illegal resulting in a very expensive bill to be paid as remedy.
For more information about CCSAGE Naturally Green’s Judicial Review of the GEA.
The following media report has an edited written version of Mr.Whiteley’s presentation to the Ontario Fair Hydro Act 2017 committee in June 2017:
“The legislature and all Ontarians must be able to rely on the Province’s consolidated financial statements to fairly report the fiscal results for the year. This year they cannot do so”
-Auditor General of Ontario
What have been the costs of Ontario’s energy policies? The Auditor General of Ontario highlights issues in the Government’s fiscal reports in its recent news release.
Impacts of energy policy decisions can be found within the example of ongoing discord over the build out of renewable energy projects such as wind facilities. The Government continues to face criticism over its failure to undertake cost and benefit analyses. Economic stress is being realized and demonstrated by the rapid and dramatic rises in electricity rates and the threat of even more bill spikes predicted. Higher electrical bills remain the trend despite Government’s reduction measures recently introduced.
“Lysyk also warned that the accounting design the Government created for the electricity bill reduction under the Ontario Fair Hydro Plan Act, 2017 may lead to a larger understated deficit and net debt next year. A Special Report on this subject will be tabled in the fall. “
Energy poverty and economic impoverishment are personal threats to individuals, families and communities who are struggling to get by. Politicians massage numbers to fit desired images they want to create and sell but at the end of the day it results in selling out the people they were elected to serve.
Wind Works Power Ontario Update – 48MW reach COD, end of Ontario Operations
(via TheNewswire)
SCHENECTADY, NEW YORK, UNITED STATES / TheNewswire / August 23rd, 2017 Wind Works Power Corp. (OTC:WWPW -News) is pleased to announce that it has completed its Ontario projects consisting of 24xSenvion 2MW MM100 turbines. Wind Works had developed the projects in Ontario and applied for and received the FIT contracts from the Ontario Power Authority in 2010. Wind Works joined forces with Capstone Infrastructure in a joint venture, which eventually acquired the remainder of the projects after commercial operation was achieved. The projects total 48MW and include the Wind Works projects Ganaraska, Grey Highland ZEP, Settlers Landing, and Snowy Ridge, all of which have achieved commercial operation.
Wind Works has agreed with the government of Ontario to terminate the FIT contract applied for in 2009 and awarded in 2010 to the Cloudy Ridge project. The project received its REA permit from the Government of Ontario in December 2015. Wind Works had furthermore increased the interconnection deposit by approx. CAD $5.5M in December 2015 after HONI had previously changed the POI and PCC of the project due to other projects dropping out. Wind Works had also made down payments for 5 wind turbines from Senvion which have been manufactured and were awaiting onsite transport. Despite the late stage development process, given repeated governmental uncertainties, Wind Works was forced to terminate the FIT contract.
Given that the government of Ontario recently cancelled the previously repeatedly announced second bidding process for up to 850 MW renewable energy, and given the loss incurred by Cloudy Ridge due to repeated governmental uncertainties, Wind Works has decided to terminate any activities in the uncertain and unpredictable Ontario renewable energy market. Consequently, WW has cancelled its previous plans to invest a further $300 Million in Ontario and to focus instead on the US market.


 Alan Whiteley is the legal lead for the Judicial Review before the Courts of