Three people were arrested and various homes and office buildings were raided on Tuesday in an investigation into 8 million euros worth of fraud committed by Dutch investment company Hollandsche Wind. The Public Prosecutor and tax investigative service FIOD also seized several cars, Tubantia reports.
According to FIOD, the now bankrupt Hollandsche Wind was used to commit Ponsi fraud – an illegal pyramid scheme. Investors paid a minimum of 5 thousand euros and were promised high returns on wind energy projects. But their returns were paid with money from new investors. No money was ever invested in wind farms or real estate. According to the Prosecutor, the fraud amount is around 8 million euros…..
Kory Feick is no longer able to work in her garden or spend much time outside because the wind turbines cause her severe nausea and headache.
“3.3 Motion sickness from oscillations
International ISO standard 9996:2000 defines motion sickness from exposure to actual or perceived oscillatory motion; “motion sickness is a commonly experienced and sometimes severe but reversible (i. e. physiological) disorder specifically associated with exposure to actual or perceived oscillatory motion in the frequency range 0,1 to 1 Hz. One or more of a constellation of symptoms (with or without frank vomiting) may affect the sufferer. ”……
Blade pass frequencies observed in spectrogram analysis at homes near the vicinity of the Golden West Wind Facility fall within 0.2 to 0.85 Hz, within the range associated to motion sickness.”
Preliminary Field Report Independent Infrasonic Investigations: Vicinity of Golden West Wind Facility, El Paso County, CO
By Robert W. Rand, ASA, INCE
Rand Acoustics, Boulder
January 29, 2016
Summary
Differential acoustic pressure measurements were acquired and logged at three homes in the vicinity of the Golden West Wind Facility in El Paso County, Colorado during December 2015 and January 2016. A week of data was analyzed for each of the three homes and daily spectrograms produced which are attached. Each day’s data consisted of approximately 4.3 million differential pressure samples with a week comprised of some 30.5 million samples.
Preliminary investigation confirmed the presence of recurring acoustic pressure oscillations at 0.2 to 0.85 Hz (the “blade pass frequency” or BPF) which are associated to the Golden West wind turbine rotations. At times multiple oscillation frequencies were observed, consistent with multiple turbines operating at different rotation rates. Oscillations appeared to be more pronounced when the turbines are more upwind rather than downwind. Neighbors reported they are mostly downwind due to turbine location relative to home location and for the prevailing winds in the region.
Typical BPF total acoustic power were computed for example portions of the differential pressure data sets. Crest factors (the ratio of RMS to peak levels) were also computed for segments dominated by wind turbine rotation and uncontaminated by other noise, with typical crest factors of 13-19 dB. Totalized BPF RMS levels ranged from 56 to 70 dB re 20µPA, with peak levels from 71 to 89 dB. The RMS and peak levels are similar to those found at other sites with appeals to stop the noise, legal action, and homes abandoned.
It is understood from neighbors that they have experienced disturbance since the turbines started operating whereas prior to turbine operation there was no similar disturbance. It is understood that neighbors report improvement when turbines are shut down (not rotating) or when they remove themselves physically away from the Facility a distance of several miles.
El Paso County noise regulations define “Sound” as oscillations in pressure (or other physical parameter) at any frequency, and, prohibits noise disturbance due to acoustic oscillations.
The analysis is far from complete in that numerous segments of each day at each monitoring location could be analyzed and associated to journal entries and/or medical data. The reported association of proximity to the operating facility to disturbance in health and quality of life appears supported by the acoustic data acquired for this preliminary investigation. These preliminary investigations suggest that there is a condition of noise disturbance due to very low frequency acoustic pressure oscillations in the vicinity of the Golden West Wind Facility when it is operating, with more severe impacts downwind.
Following the Ontario Energy Minister’s statement that there is a robust supply of energy for decades to come, the Association to Protect Amherst Island (APAI) called on the Provincial Auditor-General, Bonnie Lysyk, to examine why the provincial Liberal Government is not exercising its right to terminate an expired wind turbine contract signed in February 2011 and save the Ontario taxpayers more than $500MM over the next 20 years. Windlectric, a subsidiary of Algonquin Power and Utilities Corporation, continues with plans to build a 75 MW wind project on Amherst Island that would produce unnecessary and expensive electricity costing $140 per MWh.
Although Premier Wynne admitted that the “green energy” policy is a mistake and that the electricity rates were too high, the Association’s numerous attempts to have the project terminated have been ignored. Michèle Le Lay, APAI President, questioned the Liberal Government’s logic: “Why is the Government proceeding with the industrialization and the destruction of the natural and cultural heritage of a community, allowing twenty-six, 50-storey-tall wind turbines to be built in bird and bat migratory routes, endangering at-risk species’ habitats and at the same time, risking the health and safety of the people who live there for unneeded, costly energy?”
She explained that: “Right across the channel from the Island, the Lennox and Addington Gas Plant operates at less than 3% capacity and the new Napanee Generating Station being built right beside it is slated to operate at about 30% capacity. Even worse, in early 2017, the Ministry of Energy forced the closure of Northland Power Generation Station (across from the Island) that offered to provide electricity to the grid for $59 per MWh. Something is not right about all of this”. She added : “The Liberal Government could save the Ontario taxpayers and electricity consumers between $400- and $600-million dollars over 20 years by cancelling the Windlectric contract”.
“Ontario taxpayers could use a break on their electricity bills. Why pour more money into the pockets of a large utility at taxpayers’ and electricity consumers’ expense?” said Mayo Underwood, a resident of the Island.
A formal letter has been sent to the Auditor-General of Ontario seeking a financial investigation on why the Ontario Government refuses to terminate an expired wind turbine contract and agrees to pay for the next 20 years a wind company the highest rate ever ($140 MWh estimated average rate) for unneeded electricity.
Contact(s): Michèle Le Lay (613) 929-2979 or protectai@kos.net
Interesting paper that challenges the conclusions published using the data collected for a study concerning sleep disturbance and wind turbine noise from a wind project located in West Lincoln, Ontario. Turbines up, documented acoustical environmental changes, sleep disturbances. Does the data support and validate the conclusions published in “The impact of psychological factors on self-reported sleep disturbance among people living in the vicinity of wind turbines,” by Leila Jalali, Mohammad-Reza Nezhad-Ahmadi, Mahmood Gohari, Philip Bigelow, & Stephen McColl, published in environmental research, volume 148, July 2016, 401–410″? Not everyone agrees.
Internationally deaths of the iconic raptors by wind projects remains an ongoing environmental horror story. The writer in the letter below asks questions about the deference granted to wind facilities who are in essence given licence to kill unlike any other industry.
If wind turbines are subject to wildlife areas, what happens if an eagle is hit and killed or wounded by a wind turbine? Eagles are an endangered bird and are protected by the Federal Gov. law. I read on the internet, the first offense is a $5000 fine and or one year in jail. Second time it is $10000 fine and two years in jail. Third time, if that is a felony, the fine is $250000 and jail time. Now, question is, who is to blame for the death or wounding of the eagle? Remember this is a federal crime if one is killed or wounded according to the message on the internet. Who would pay the damages or the jail time? Would it be the wind turbine company, the land owner, or would it be the county supervisors who made this decision on their own to allow the wind companies to come in by rezoning, or would it be all three?
The Lesson: This project was a disaster from the beginning. Speed and greed are a recipe for environmental, economic, and social failures. Applications for future wind developments must learn from this experience and be much, much more diligent and responsible in their planning and execution.
Desert Report March 2017 – Parke and Linda Ewing
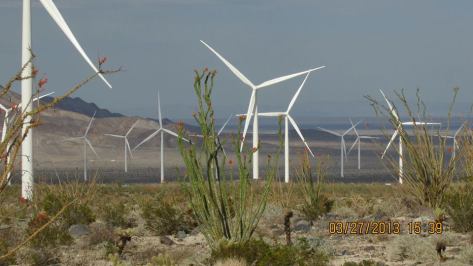
The Ocotillo Wind Energy Facility (OWEF)1 is an utility scale project placed on 12,436 acres near Ocotillo, California, of which 10,151 acres are public land managed by the Bureau of Land Management (BLM). Let’s not forget the towns of Ocotillo and NoMirage. Not huge towns, but home to 266 residents who chose the solitude, the quietness, and the beauty of the ever-changing seasons. Much of this beauty, along with the ecosystem, has been sacrificed.
This wind energy facility now consists of 112 Siemens 2.3-108 MW Industrial Wind Turbines (IWT), which means each IWT was rated to produce 2.3 Megawatts (MW), and the blade swept area is 108 meters in diameter (354.331’). At a later date, the rating was increased to 2.7 MW per tower, very likely to meet the minimum installed capacity required by the California Public Utilities Commission (CPUC) if San Diego Gas & Electric (SDG&E) is to meet their mandated renewable energy requirements.
The nacelle, which houses moving and support components such as the gearbox, generator, and main shaft, sits on top of a round tapered steel tower 80m (262.467’) above the ground. The 173’ long blades are held in place at a hub which is attached to the end of the nacelle. The total height of the wind turbine when a blade is in the 12 o’clock position is about 438’. The base of the tower is 15’ in diameter and houses the inverter and control equipment. Two cooling fans are placed outside of the base under the entry stairway, and the transformer is placed on the ground next to the base. More data can be found at Wikipedia2 and at the Siemens’ link3. All these links are posted in the “Notes” section online at http://www.desertreport.org.
Public Involvement
How did this happen? Initially, when we first heard about this project, we were told by Pattern Energy officials and by project documentation that we, the residents, would not be impacted by the turbine facility because it would be located five miles away from the Ocotillo Community. Five miles? That’s an acceptable distance. My wife and I now have turbines that reside one-half a mile from our house and with most less than one mile from the community on all sides.
There were so many maps presented during the different meetings with the various Imperial County departments that confusion ran rampant when someone asked which map represented the location of the turbines for this project. During a scoping meeting, a meeting designed to gain input from every single entity, person, department, or facility that may be impacted by this project, the residents were not allowed to speak. Instead, we were instructed to write our questions on a post card, and they would be addressed at a later time. When?
Ground Disturbances
Now let’s talk about the turbine access roads. Initial discussions and documentation indicated that these roads would be thirty-six feet wide and then narrowed to sixteen feet once the project was complete. In addition there would be an additional fifteen feet on either one side or both sides for the electrical collection lines from each turbine. Some roads ended up being up to 113 feet wide. The disturbance caused to Native American sites and to wildlife has been recorded many times4.5.
Many homeowners have felt the need to purchase flood insurance, in the middle of the desert. Residents feel that Pattern Energy was allowed to change the drainage patterns that will affect the alluvial fans, causing flooding by diversion of rain runoff. Construction of forty-two miles of access roads and an additional eighty-two miles of collection lines has stripped the water absorbing desert crust, creating the potential for flooding in areas that have been safe in past years.
Initial Wind Estimates
The next indiscretion that made itself Somewhere on this map is a community now surrounded by industrial project. known were the wind values. The wind values were incorrectly stated – records were from the Desert View Tower located ten miles up the Interstate Highway grade from Ocotillo and approximately another 2500 feet higher than the desert valley where the project is located. How were they allowed to use those numbers? Three years of data have shown that these turbines are not generating the power that was projected.
Production Shortfall
During the permitting process, differing estimate were given for the energy production of the facility depending upon who made the estimate and for whom they were intended. Ultimately Patten Energy stated that the OWEF would have a capacity factor of 34% (meaning that over time it would produce 34% of its maximum rated output at full sunlight) and that it would produce 2673 gigawatt hours (GWh) of energy in its first three years. In fact, the actual capacity factor during this period was 21%, and the total energy produced was 1438 GWh, far below the projected figures. This was in spite of receiving $115,890,946 dollars from the Department of Energy’s 1603 Cash Grant Program6 in lieu of the Production Tax Credits and $110,000,000 from the Border Environmental Cooperation Commission7.
During the BLM scoping period for the project, many comments were submitted. The majority of these were in opposition to the OWEF. Comments that favored the facility were mostly based on the jobs and economic benefits that the facility would provide. A small minority of the comments favored the facility because of the sustainable renewable energy benefits. Those claims were based on the “Installed Capacity,” which is the maximum power which the facility can generate at full daytime sunlight, and an expected capacity factor of 34%. Ocotillo Wind, as stated previously, has fallen far short of predictions.
Current electricity generation for the residents of California relies on a mix of energy production technologies including: coal (7.7%), natural gas (41.9%), nuclear (13.9%), other renewables (13.7%), hydroelectric (10.8%), and others (12.0%). Based on nearly 204,000 GWh of net power generation in California in 2010, the average annual production of 479 GWh by the Ocotillo facility represents only 0.2 percent of California’s total. It is reasonable to wonder if the negative consequences of the project can be justified by this small contribution.
Mechanical failures
The OWEF has been plagued by mechanical problems. On May 16, 2013, a 173’ long wind turbine blade was thrown off of Turbine 156. The cause was determined to be a fiberglass root segment curing problem. Ten wind turbine blades were ultimately replaced at Ocotillo Wind. Many people familiar with the facility believe that the blade problem was due to the “fast tracking” of the facility to enable Ocotillo Express LLC to complete the project by the end of 2012, so they could qualify for the 1603 Cash Grant offered by the Department of Energy.
On January 15, 2015, Turbine 110 had a major fire. The cause of the fire was never revealed. The entire turbine was eventually replaced. The turbine did not generate power for nine months.
On November 21, 2016, Turbine 126 collapsed entirely. It was later confirmed to have been caused by a turbine blade striking the side of the tower. According to the Ocotillo Wind website, a shear stiffener inside of the blade was found to have failed. The Ocotillo Wind website8 stated that the turbine actually collapsed “in the Designated Safe Zone.” There are easily twelve wind turbine sites where BLM designated trails fall within that so-called designated safe zone. Potentially, a person could be killed under any of the Ocotillo Wind Turbines since the entire area is open to
the public.
The OWEF has been plagued with oil leaks. The residents of Ocotillo have counted over seventy turbines with oil leaks at towers and countless hydraulic oil leaks on the blades, many of them considered to be significant by the Imperial County Environmental Task Force. Additionally failures of yaw drives (which orient the blades into the wind) have caused problems. Eight gearboxes have been replaced since the facility became 100% operational along with hundreds of yaw drives.
Visual Blight
The bright red blinking lights of Ocotillo Wind are required by the Federal Aviation Administration (FAA) and can be seen from the southern portion of the Salton Sea, over seventy miles away. Nobody lives in the desert to view wind turbine lights blinking in unison all night long. Pattern Energy promised the community a lighting control system which would be radar activated only when aircraft were present. The Laufer System9 was approved by the FAA in January of 2016. Pattern constructed the whole first phase of Ocotillo Wind consisting of ninety-four turbines in a record 6 1/2 months, but it has been over a year, and the very irritating red lights still shine.
Death in the Air
Many birds have been struck by the wind turbine blades, and bats lungs have exploded as they fly near the turbines. A carcass survey between 10/05/14 and 09/22/15, obtained by a FOIA request, indicated that sixty-nine birds and bats were found on the agreed upon survey sites, under or near the wind turbines. Every wind turbine site on the facility was not searched every day. We can assume that scavengers consumed many of the carcasses prior to the survey. Bird kills don’t appear to be a huge problem in Ocotillo, but we all hate the killing of any wildlife.
The once numerous Red Tailed Hawks have disappeared. Were they killed by spinning wind turbine blades? There were once so many jackrabbits that it was overwhelming. Now there are no jackrabbits, and the coyotes have also disappeared completely. The last time we saw one, it was skinny and sickly looking, almost certainly for lack of food. The ecosystem is gone.
The Lesson
This project was a disaster from the beginning. Speed and greed are a recipe for environmental, economic, and social failures. Applications for future wind developments must learn from this experience and be much, much more diligent and responsible in their planning and execution.
My project is the Niagara Region Wind, which consists of 77, 3.0 MW 124m height, plus the blade length which is 101m tip to tip. These turbines exceeds the span of a Boeing 747. In my backyard. I live in Haldimand County.
It is very hard to post everything about the projects, from noise, visual pollution, a community driven apart and divided, to human health, environmental health, the corruption uncovered, the rights you no longer have and the push backs from every single level of government there is. Not one single level of government will converse with you, they have a standard response they give to everyone.
I have one IWT 680m from my home, 417m to my property line. I have one 1022m from my home, another 1322m from my home and a transfer station is 900m to my home. Within 3km’s of my home there is at least 20+ turbines.
I live remotely, dead end street with 23 beautiful acres.
It’s a very different life. There is no more quiet space. There isn’t any quiet time anywhere. They are enormous, unsightly. Visually distracting, Visually disturbing, night and day. At night I have blinking red lights that penetrate our home.
I am on a prescription for vertigo, cabin pressure and motion sickness. This is a way of life I have never dreamed of living, nor thought would ever happen. This is MY new life, not chosen by me, but rammed down my throat by the incompetent greedy corrupt liberals. Yes, the prescription helps to lessen the symptoms and at times debilitating pain, but I am on a DRUG to remain in my home most days (forced out some days).
Let me explain something. I have fibromyalgia and osteoarthritis. Both of which I do not medicate or take any scribe for. I manage with a healthy lifestyle and staying active. Now, in order to not be hospitalized for violent episodes of vertigo, balance loss and vomiting, I MUST remain on a prescription.
I can not convey my anger at this situation correctly. I can not convey to those who do not have turbines exactly what it is like to live with them. It is an experience that goes beyond ones ability to express correctly.
How do you tell people, the turbines haunt you 24/7. How do you explain to people the turbines and the IFS and LFS keep you awake all night.
I continue to battle for my rights. The same rights given to every Canadian and the same rights laid out in the constitution. But when you learn the GEA 2009 has over ridden rights, over ridden by-laws, abolished the MOECC, MNR rights and so on, you know you don’t live in Kansas anymore.
I am more than willing to discuss this on an ongoing basis.
Later I will post videos of the noise, the view from my living room and explain that as a mother how your FIGHT mode is triggered when a minor in your home is adversely affected. How you quietly retreat to your room to cry in overwhelming shame; Shame you can not provide a safe home for your family and yourself.
I truly am a different person than I was 7 months ago.
With each write to the government and agencies, I remind them I did not give up my rights, I did not consent to be a human trial project and their blatant disregard for human health will have consequences.
Lastly, I’d like to mention I have a fantastic Doctor. Most GP’s think its all in your head. My doctor understands LF’s and IFS. Due to the immense cabin pressure in my ears he acknowledges it’s time to start tracking nerve damage seeing as we are at the early stages, nerve damage which will cause hearing loss. I will be going for extensive hearing tests until further notice.
There is so much more to write….
Suncor wind turbines located in Adelaide Metcalfe, Ontario have generated another documented case of residents forced to abandon their home due to wind turbine noise. The letter from James and Heather Dymond reaches out to Mayor and Council demanding they find a solution. If you are also impacted it is important no matter what they say or what you are told know this- you are not alone. Please continue to speak up and send in your letters to those who are mandated to protect us.
February 15, 2016
I’m writing today to ask Adelaide Metcalfe council to find a solution to the issues surrounding Suncor wind turbines, that are causing us to have to vacate our house at night, as well as some days – since April 2015. We pay taxes to the township for a home that we can no longer enjoy. We have to leave at night to get a break from the incessant infrasound emitted from the turbines. It is a sound that one can feel more than hear.
I am suffering from nausea, vertigo, and at times extreme headaches, wherein I have to leave the house immediately to get any relief. I’ve spent countless hours in the searing sun in the summer, because I couldn’t stay in the house without feeling like vomiting. I am now on prescription meds for vertigo which I have never experienced before. The meds help somewhat, but don’t eliminate the problem. My work is livestock based on the property, and I have noticed negative effects on my livestock as well.
Suncor has been contacted, and has informed me that I am the only one with any problems and that the turbines are running within guidelines. We have not signed a contract with any wind company, yet are forced to live with the problems they create.
Since the family of Mary Ann Hendrikx has approximately six wind turbine contracts with Suncor, I have not included her on this email as it is a conflict of interest.
The proposed industrial wind turbine “farm” is not welcomed by the majority of the people. It will inhibit our view of the sky, cause health problems for people and animals, and cost this community, and surrounding communities a fortune in lost property values and revenue.
At a recent town hall meeting in Hopkinton, one of the contract holders stated, “Where is National Grid based?” This was in response to the issue of Iberdrola being out of Spain. Well, this was the most pathetic attempt at drawing a parallel that I’ve heard, so far.
Dear Mr. Contract Holder, National Grid does not require me to erect anything on my property that robs my neighbors of their health and property values. National Grid does not sneak into our community, like a snake in the grass, to pit me against my neighbors to further their subsidy mining. National Grid is providing a necessary evil, I’d love to be off grid.
I could go on, but I want to tell you about the woman who spoke before him. She stood up to tell us how she needed this contract to pay her taxes. Her tax burden was too heavy. She went on to talk about how the house across the road from her had been on the market for three years and hadn’t sold.
Maybe it’s because her property, directly across the road is contracted to house industrial wind turbines? And that’s part of disclosure to potential buyers. Could she possibly have her Iberdrola blinders on too tight? There are a lot of elderly people in our community. They will be passing on, who’s going to buy their properties with industrial wind turbines hulking over them? And you, Mr. and Mrs. contract holder, what if no one wants to buy or inherit your property when you pass on. God willing, my husband and I will be alive for another 50 years or more.
We don’t want to deal with your shortsightedness. Some of you are very near the end of your lives, at least statistically. When you’re gone, people will either lament your passing, or want to forget what you did to our community. Will your families want to be associated with the so and so’s of Hopkinton/Parishville, who destroyed the quality of life for an entire community, to make a buck?
Finally I’d like to state that we don’t hate people for their mistakes, and implore the same from you. If you’re a contract holder, you have most assuredly made a mistake. Iberdrola is a $44 billion company. Blindsided, you were no match for them. It’s a mistake we may have made, if we were in your shoes. We have seven children, five still living at home. Money is important, and fun! But there’s good money and bad money.
Whether God allows this project to come to completion or not, all of us need to put our differences on this matter aside and rise above the mess that Iberdrola has brought to our community.
Premier Wynne’s $50-billion elephant – Parker Gallant Energy Perspectives
Do a Google search of “premier wynne+elephant in the room” you get 1,140,000 hits while a search for just “premier wynne” only gets 486,000 hits. The word “elephant” has been used by Ontario’s premier on a number of occasions. For example, the “elephant” popped up at one of the expensive Ontario Liberal Party fundraising dinners a year ago where she declared, referring to the provincial deficit, “So while some want to characterize Ontario’s deficit as the elephant in the room, I think a panda is the more appropriate metaphor,” she said. “Truly, Jia Panpan and Jia Yueyue [visiting pandas at the Toronto Zoo] were adorable. But the pandas are leaving Ontario in 2018, and in 2017-18 our deficit will be gone, too.”
The “elephant” has returned for her government in the form of high electricity prices but instead of cute little “pandas,” Premier Wynne was forced to call them her “mistake”!
Let’s look at that elephant now.
The recent release of Ontario Power Generation (OPG) 2016 annual report provides enough information to allow one to figure out exactly what created the elephantine mistake and where to point the finger. To do that we will compare the results of 2016 to 2009* and show the cause of the above market climb in electricity prices.
Price Comparison
IESO’s (Independent Electricity System Operator) data discloses the cost of electricity generation in 2009 was 6.22 cents/kWh or $62.20 per megawatt hour (MWh) or $62.2 million/TWh (terawatt hour) and in 2016 was 11.32 cents/kWh or $113.20/MWh or $113.2 million/TWh. The increase from 2009 to 2016 represents a jump of 82% in only seven years and in simple terms, is a jump of 11.7% annually.
Using the above prices to show the full cost of electricity generation in those two years is accomplished by multiplying total generation by the cost per TWh so:
Total generation 2009: 148 TWh X $62.2 MM= $9,205 MM
Total generation 2016: 149.5 TWh X $113.2 million = $16,923 MM
(Source: IESO)
That means an increase of $7,718 million (+83.8%) in the raw cost of the commodity-electricity.
Finding the “mistake”
Why did the cost jump 83.8%?
Let’s start with the generation produced by OPG who, according to their 2009 annual report generated 92.5 TWh and 78.2 TWh in 2016. Bruce Nuclear in 2009 generated 35.7 TWh and in 2016 they generated 46.1 TWh. Collectively OPG plus Bruce generated 128.2 TWh in 2009 and that represented 86.6% of total generation (148 TWh) by all generators that year. In 2016 the collective total was 124.3 TWh which represented 83.1% of all generation (149.5 TWh) in that year as reported by IESO.
Costing the generation
2009
For OPG: The costing of generation coming from OPG is a relatively simple task requiring only their gross revenue for the year divided by the generation they reported. For 2009 gross revenue was $5,640 million for the 92.5 TWh delivered making the all-in cost $61 million/TWh.
For Bruce Nuclear: The reported price paid to Bruce was $65.90/MWH. So, for the 35.7 TWh they generated, the gross revenue generated was $2,352 million or $65.9 million /TWh.
The combined costs of $5,640 million from OPG plus the $2,352 million from Bruce was $7,992 billion to produce 128.2 TWh making the combined cost per TWh $62.34 million or 6.23 cents/kWh.
As noted above, total costs for all generation reported by IESO for 2009 was $9,205 million meaning $1,213 million ($9,205 million less OPG/Bruce combined of $7,992 million) was spent to acquire the 19.8 TWh generated by the other private generators, making their costs per TWh $61.3 million or 6.13 cents/kWh. (Note: 9.8 TWh was generated by OPG’s coal plants in 2009.)
2016
For OPG: As noted above OPG in 2016 generated 78.2 TWh and their gross revenue was $5,653 million making their generation cost per TWh $72.3 million (7.23 cents/kWh). Included in OPG’s gross revenue was a $207 million payment for hydro spillage of 4.7 TWh due to SPG2. (surplus base-load generation).
For Bruce Nuclear: Bruce in 2016 generated 46.1 TWh at a reported cost of $66 million/TWh making so gross revenue was $3,043 million including the cost of steaming off almost 1 TWh due to SBG.
The combined costs of $5,653 from OPG plus the $3,043 million from Bruce was $8,696 million to produce 124.3 TWh making the combined cost per TWh $70 million or 7.0 cents/kWh.
Cost of the “other” generation
The all-in costs for generation for 2016 was, as noted above, $16,923 million. If one deducts the combined costs of OPG and Bruce Nuclear for their generation in 2016 ($8,696 million) the balance of $8,227 million went to pay for the 25.2 TWh produced by other generators. Simply dividing the $8,227 million by the 25.2 TWh creates a cost per TWh of $326.5 million or 32.7 cents/kWh. ***
Had the 25.2 TWh cost ratepayers $70 million/TWh, or the same as the OPG/Bruce Nuclear generation combination (25.2 TWh X $70 million = $1,764 million), Ontario ratepayers would not be on the hook for the $6.9 billion in excess costs! ($8,227 million – $1,764 million= $6,932 million or the very high $326.5 million/TWh)
In just one year’s data, compared to 2009, we have located many of the reasons for higher electricity costs. The Premier now claims $50 billion was needed to invest in transmission and generation but her “mistake” was in not seeing the costs would go up more than 83%, principally related to the acquisition of intermittent, unreliable renewable energy from wind and solar!
There may be even more elephants in this particular room.
*The choice of 2009 is related to the Legislative passage of the Green Energy and Green Economy Act (GEA) in the Spring of that year creating the FIT and MicroFIT programs and subsequent acquisition of renewable energy at above market prices.
**Surplus Base-load Generation is simply anticipated “base-load less Ontario demand”.
***The per TWh cost reflects the FIT contracted generation for industrial wind turbines, solar panels, bio-mass along with curtailed wind, conservation spending, the cost of selling our surplus power to other jurisdictions at only 15% of its cost, etc. etc.

 IMMEDIATE RELEASE
 Interesting paper that challenges the conclusions published using the data collected for a study concerning sleep disturbance and wind turbine noise from a wind project located in West Lincoln, Ontario. Turbines up, documented acoustical environmental changes, sleep disturbances. Does the data support and validate the conclusions published in “
 Southern Ontario has 4 publicly known (to date ) eagle deaths caused by wind turbines. READ:
 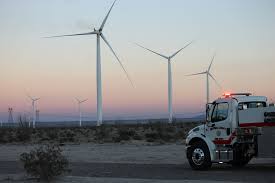 The Lesson: This project was a disaster from the beginning. Speed and greed are a recipe for environmental, economic, and social failures. Applications for future wind developments must learn from this experience and be much, much more diligent and responsible in their planning and execution.
 Public Involvement


 Visual Blight
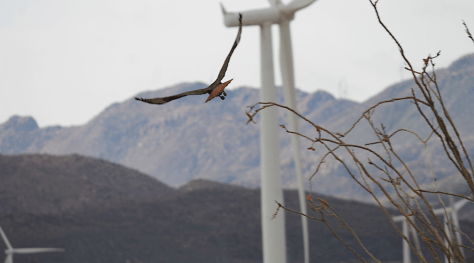
 My project is the Niagara Region Wind, which consists of 77, 3.0 MW 124m height, plus the blade length which is 101m tip to tip. These turbines exceeds the span of a Boeing 747. In my backyard. I live in Haldimand County.
 Suncor wind turbines located in Adelaide Metcalfe, Ontario have generated another documented case of residents forced to abandon their home due to wind turbine noise. The letter from James and Heather Dymond reaches out to Mayor and Council demanding they find a solution. If you are also impacted it is important no matter what they say or what you are told know this-
  To the Editor:
 Premier Wynne’s $50-billion elephant – Parker Gallant Energy Perspectives
