Andrew Coyne: Liberals, keep your moralizing mitts off our Canada Pension Plan
McKenna’s tweet was just the usual non-stop, 24-hour moralizing we’ve come to expect from the primly ideological fanatics in this increasingly ridiculous government
It’s probably nothing. It was just a tweet, after all.
But when the federal environment minister, Catherine McKenna, posted her approval of a recent Canada Pension Plan Investment Board decision, it caused a little flutter of alarm among those who follow these things.
“Now, this is something that Canadians can be proud of,” she cheered, linking to a story about the CPPIB’s plans to invest more than $3 billion in green energy projects, “as it prepares for the global transition to a lower-carbon economy.”
Ministers of the Crown do not normally comment on CPP investment decisions, approvingly or otherwise, and with good reason. Though the federal and provincial governments set the broad terms of the plan’s operations — how much it collects in “contributions” from employers and employees, etc — the CPPIB, which is responsible for investing the $356 billion accumulated in the CPP Fund, is supposed to operate at arm’s length from all of them.
Now, this is something that Canadians can be proud of. The CPP
is planning to invest more than $3 billion in renewable energy as it prepares for the global transition to a lower-carbon economy. https://t.co/hsssiwYE47
I am writing to you and your esteemed colleagues requesting that the new PC majority government repeal the Green Energy Act with the swiftest possible speed. I know you have railed against this misguided piece of legislation. Indeed, your estimate of its low caliber is echoed by Pierre-Olivier Pineau, Associate Professor and Electricity Market Expert, University of Montreal HEC Business School, who opined that “Ontario is probably the worst electricity market in the world.” (https://www.forbes.com/sites/judeclemente/2016/03/30/ontarios-high-electricity-prices-crush-business/#2a8c5ab44587)
As you know, this Act has been a disaster on many fronts – its inability to effect the desired reduced CO2 emissions, its harmful effect on the environment, its negative impact on the economy and our electricity rates, its stripping of municipal planning and zoning rights, and importantly, its deleterious impacts on rural residents who only want a safe and quiet place to enjoy their homes and properties.
1. Tweaking the GEA is folly, as the very Act is based upon faulty foundations – that the wind is free, clean, and always blowing somewhere. This myth fails to take into account that wind is unpredictable, non-dispatchable, unreliable and inherently intermittent. When added to a power grid designed entirely around dispatchable sources, it leads to grave system instability. As renewable energy sources are added into the mix, their impact is exacerbated by an inability to match loads (demand) with supply, as supply would be increasingly and inconveniently dictated by phenomena like the weather (and sunset). The green mantra also fails to acknowledge the requisite concomitant use of fossilk fuels (particularly, gas) run in an open cycle, stop and go, inefficient mode like the Don Valley at rush hour. And it fails to deal with the vast stretches of weather system patterns and the transmission requirements necessary to connect with Dorothy in wind-blown Kansas.
2. Furthermore, mere enforcement of GEA regulations is an insipid approach. The regulations fail to include infrasound, low frequencies, high frequencies, amplitude modulation, stray voltage, vibration, the trespass of shadow flicker, the destruction of prime agriculture lands, disturbances to water wells, impact on livestock and wildlife harm/harassment/ kill/displacement, among other winning features of IWTs. Nor does it address the legality of gagging lease holders from discussing health impacts, thereby precluding public safeguards. Moreover, the existing regulations regarding acoustic testing and monitoring, when implemented at all, are cumbersome by design, rarely feasible, and statistically dishonest.
3. The only honourable approach to addressing the Green Energy Act is to cancel it. In a Financial Post article entitled “Yes, Ontario’s Liberals can cancel their terrible renewable power contracts—and they should do it now”, (Lawrence Solomon, September 2016) argues for “cancelling Ontario’s odious renewables contracts”. He writes:
Mr. Ford, many rural residents have been holding on for a June 7th PC win as their last hope in dealing with the adverse living circumstances imposed upon us by the McGuinty-Wynne dynasties. I encourage you to repeal this disastrous Green Energy Act and return our homes and our pastoral farmlands to their idyllic pre-GEA state.
Ontario’s Liberals lost official party status in the recent June 2018 vote for the provincial elections, under former Premier Wynne’s leadership. Energy policies and rising electricity rates were a hot button election issue.
Struck by a Hockey Puck: Renewable Energy’s Big Canadian Black Eye
Everybody loves renewable energy, right? That’s what surveys tell us with global support for renewable energy consistently polling above 80 percent.
But don’t tell that to the people of the Province of Ontario, Canada. On June 7, the electorate handed a stunning defeat to its Liberal Government after 15 years of reign. The election winner: Conservative Doug Ford, brother of Toronto’s infamous crack-cocaine smoking mayor, Rob Ford. The issue in the forefront of voters’ minds: sky high electricity prices.
Ever since the Ontario Government invoked its Green Energy Act in 2009 to transition away from coal power to wind and solar energy, electricity prices have risen a whopping 75 percent. In Ontario, electric bills have become as frequent a topic of water-cooler conversation as apartment rents are in Manhattan or San Francisco.
Without question, on every measure of ratepayer protection Ontario is an egregious case of how not to design a renewable energy program:
Most Feed-in-Tariff (FIT) rates set not by competitive bidding but instead by Government decree at levels as high as $C 80.2 cents ($US 62 cents) per kWh for 20 years
No mechanism to automatically adjust FIT rates downward as capacity deployment thresholds were reached
Domestic Content requirements that raised domestic equipment prices above global average selling prices
A rule that ratepayers still provide FIT payments for energy even when energy production is curtailed
An allowance of five years after FIT contract execution for facility construction, creating windfall gains for developers as equipment costs declined while preventing ratepayers from participating in any of those savings. How did Ontario get their renewables policy so wrong?
“The Green Energy Act is toast,” he added. “But the act is a very large, far-reaching piece legislation. It’s not just about some wind and solar generation. It has huge impacts on the administration of the electricity system.”
Post-election analysis: Five key local issues to watch
From deeply divisive wind energy projects, to school closings and transportation, five issues loomed large in the London region during the Ontario election.
GREEN ENERGY: ‘The pigs are not going to fly’
Randy Richmond
The London Free Press
Despite Doug Ford’s commitment to tear apart Ontario’s energy system, consumers shouldn’t expect to see much change in their electricity bills, says an energy analyst and researcher.
“Don’t expect your rates to go down. The overall cost of power is likely to rise over the next four years. The power system will look a lot like it does today,” Tom Adams said.
What will likely be gone: The Liberals’ $600-million conservation fund that paid homeowners for installing energy efficiency upgrades.
But even that won’t come without strong opposition, said Adams, author of several academic papers on energy and a consultant for consumer organizations.
Ford has promised to scrap the controversial Green Energy Act, the legislation that led to costly wind turbine projects across Southwestern Ontario – often over the objection of municipalities stripped of control over the location of energy projects.
The legislation became the flashpoint for anger over rising energy bills, which were caused only in part by sweetheart contracts with green energy suppliers.
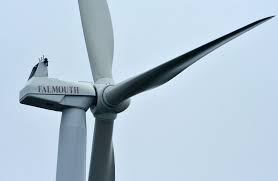
FALMOUTH — An eight-year legal battle between the town and residents who live near two controversial wind turbines at the municipal wastewater treatment plant off Blacksmith Shop Road has been brought to a close with the recent settlement of three remaining court cases involving monetary damages.
The town’s insurer paid the 10 complainants named in the suits a total of $255,000, according to Town Counsel Frank Duffy.
Eight litigants agreed to settlement amounts in March and have already been paid. Linda Ohkagawa, Kathryn Elder, Brian Elder, Todd Drummey, Terri Drummey, Robbie Laird, Mark Cool and John Ford each received $22,500.
While those amounts fell short of their legal expenses, the group decided to accept the payments.
“It was not wanting to pay any more for the grease to turn the wheels of the justice system,” Cool said. “Everybody was so tired.”
Diane and Barry Funfar agreed to a settlement amount last week as part of a separate nuisance complaint and will be paid in about a month. Each was awarded $37,500, for a total of $75,000.
That award won’t balance the financial books for the couple, who had to remortgage their home three times to cover the cost of their attorneys during years of court hearings.
A key question at the top of my Hydro One electricity statement is “What am I paying for?” According to Hydro One the charge includes:
1) The cost of generating the electricity used – ‘the Ontario Energy Board (OEB) sets the cost and the money collected goes directly to the electricity generators.’
2) The delivery – ‘money collected by Hydro One to build, maintain, and operate the electrical infrastructure which includes power lines, steel towers, and wood poles covering 960,000 sq km’
3) Regulatory charges – the Independent Electricity System Operator (IESO) uses this money to manage electricity supply and demand in the province.
4) HST – harmonized sales tax
5) 8% Provincial Rebate.
In Ontario we can generate power from three nuclear power plants, 45 hydro generating stations, 30 gas plants, 38 industrial wind turbine installations, 5 solar installations and 5 biofuel generating stations. The website gridwatch.ca provides an hourly overview of power generated, Ontario demand and imports and exports.
According to the IESO we have a total installed capacity of 36,853 MW of power that could be produced per hour if all generators were running flat out. To allow for maintenance and emergencies the IESO forecasts capability at peak demand rather than using total installed capacity. The forecast capability at peak demand for Ontario is 26,704 MW/hr, which is the production of power generation we count on.
The demand for power fluctuates with time of day, day of the week, weather conditions, and season. In 2017 the average hourly demand for power was 12,031 MW per hour. Therefore, we have tremendous capacity in the Ontario power system.
It is further complicated because not all generators are equal – nuclear, hydro and gas are reliable baseload generators that can be ramped up or down. But wind and solar are unreliable, intermittent and only produce power when the wind blows and the sun shines.
To accommodate a fluctuating supply considerable flexibility exists in the system. We pay for production, but we also pay for generation that is constrained or held back from the grid. Some generators are underutilized, and we pay them to sit idle and provide backup.
Using the information provided by the Independent Electricity Systems Operator (IESO):
The least expensive power Ontario generates is HYDRO. Our cleanest, greenest, cheapest renewable energy costs $62.00 per MWh. The Ontario Hydro power generating system has a total installed capacity of 8480 MW per hour potential production, with a capability at peak demand of 5786 MW / hr. On average the output from the Hydro generating system for 2017 was 3143 MW/hr. Although we only used 54% of the capability of Ontario hydro generation plants (the rest of the time we ran the water over the dam) Hydro provided 26% of our hourly generation of power in Ontario in 2017. The Hydro supplied to the electrical grid cost $1.707 billion dollars in 2017.
The second least expensive power generated in Ontario is NUCLEAR which cost $77.00 per MWh. Nuclear is the work horse for Ontario providing more than 63% of the power produced in this province. The average hourly output for 2017 was 7551 MW per hour. Costing $5.093 billion dollars per year.
Ninety percent of the power produced in Ontario is from Hydro and Nuclear and we underutilize both these systems to accommodate wind and solar energy. The daily cost for Hydro and Nuclear power produced is $18.6 million dollars per day or $6.8 billion dollars per year.
The total unit cost for WIND power is $159.00 per MWh produced (two and one-half times the cost of hydro and double the cost of nuclear). Wind has an installed name plate capacity of 4213 MW/hr but is an intermittent and unreliable energy source and only provided 765 MW per hour or 6% of the hourly generation of power for Ontario in 2017. Using the installed capacity wind energy should be providing 35% of the power production of this province, but due to the unreliable nature of wind the production could be 0% so nineteen gas plants were built since 2003 to back up wind and solar. The daily cost of wind energy that was produced was $2.9 million dollars per day or $1.065 billion dollars per year. This does not include the amount paid for constrained wind energy so under-represents the actual cost.
If we add in the cost of constrained wind which was 3.396 million MWh in 2017 and pay that out at $120.00 per MWh then the cost increase for constrained wind in 2017 was $407.5 million. The total cost of wind energy for 2017 then is closer to $1,065 + 407.5 = $1,472.5 million dollars or $1.4725 billion dollars per year.
The total unit cost for NATURAL GAS is $188.00 per MWh produced. Because natural gas is used as a back-up power for wind and solar the demand fluctuates hourly and again we have an energy source that is also paid when constrained. The gas plants are capable of producing 10,277 MW/ hr but only produced 489 MW/ hr in 2017. So we operated the gas plants at 5% of their potential! The daily cost of natural gas energy that was produced was $2.2 million per day or $ 805 million per year plus cost for constrained natural gas.
Constrained natural gas is paid $10,000.00 per month per potential MWh of production. So with a potential production of 10,277 MWh X $10,000 X 12 = $1,233,240,000 per year. The total for natural gas would be closer to $2,038.24 million dollars per year or $2.038 billion dollars.
The elephant in the room is definitely SOLAR weighing in at $513.00 per MWh produced (eight times the cost of hydro!) The contribution of roughly 1000 MWh per day is minimal but the cost is phenomenal at just over $0.5 million per day. A cost of $203 million per year. Again, we have not accounted for the huge amount of solar energy that is embedded in the local distribution systems eg small solar installations and panels mounted on your house. So the cost of solar is grossly under-represented, probably to keep us in the dark.
If the embedded solar is indeed 2,300 MW of installed capacity (using 13% as the potential production) we have an additional 299 MW/hr solar to pay for. At $513.00 per MWh that would be an additional 299 X 24 hr per day X $513 = $3.693 million per day or $1.348 billion dollars per year. So, the total cost of solar could be closer to $1.551 billion per year. ($1.348 +$0.203)
Only 10% of our power is produced from wind, solar and natural gas, made possible by underutilizing our nuclear and hydro power generation. The total cost for wind energy in 2017 was upwards of $1.4725 billion dollars plus solar at $1.551 billion dollars plus natural gas at $2.038 billion dollars for a total of $5.062 billion dollars!
That final 10% of the power generated in Ontario is probably costing us closer to $5 billion dollars – over 40% of the total cost of the generation of electricity in this province! And we still need to include the cost of the delivery charges, the regulatory charges and the HST!! Waste, waste and more government waste as we pay for duplication, underutilization and huge government subsidies for the generation of power in Ontario.
Catherine Mitchell – a concerned citizen
Image Source: IESO Ontario’s installed generation capacity (*Note that these figures do not include generators that operate within local distribution service, except for those that participate in the IESO-administered market. Most solar facilities in Ontario are currently connected to the distribution system. )
The following is from a presentation by Anne Dumbrille, Chair of CCSAGE at the Annual General Meeting held at Bloomfield Town Hall, Saturday, May 5, 2018
Welcome everyone, special welcome to our MPP Todd Smith, Acting Mayor Dianne O’Brien and Councillor Steve Ferguson.
I am giving an update on what is happened in Ontario regarding turbines in the last year. The Good, the Bad and the Ugly – not always in that order. Good Slide 3
In 2017, the media has been more outspoken about adverse impacts of turbines e.g.,
Two major networks, Global News and Radio-Canada, carried multi-part investigative reports this past year. The three-part Global News feature spurred questions in the Legislature and forced the then-minister to act on noise complaints for several Huron County families.
Fraser Inst. Publication Mid- April. They published Understanding the Changes in Ontario’s Electricity Markets and Their Effects criticized the GEA, speaking to it causing high energy costs, losing manufacturing jobs, and not improving the environment.
Auditor General criticized Liberal accounting practices re energy costs, fair energy plan; it was well covered in major newspapers
Slide 4
Noise from turbines consists of audible and low frequency noise/ infrsound –these affect brain waves but may be inaudible.
A team at University of Waterloo has created a special chamber in which infrasound can be produced, in the hopes that health researchers can determine unequivocally effects of infrasound at levels produced by turbines on people.
Australian Court (similar to our ERT) linked wind turbine generated LFN and infrasound noise with possible diseases including hypertension and cardiovascular disease, possibly mediated in part by disturbed sleep and/or psychological stress/distress – it found an established association between annoyance (used as a medical term) and some diseases that result from prolonged stress. They say effects of LFN include motion-sickness-like symptoms, vertigo, and tinnitus -like symptoms.
It was also established that the current method adopted by windfarms to measure noise (including in Canada) — the dB(A) scale, is not suitable for the task, as it does not measure the lower frequency range. The dB(A) scale averages out the sound levels, masking the highest levels and rate of change of noise that could be causing harmful health side-effects.
This is consistent with what the UK noise association said in 2006. 12 years ago.
MOECC still will not address infrasound. Slide 5
The Environmental Commissioner’s office wrote a report criticizing the government for approving 100% of turbine company permits to kill harm and harass endangered species. Slide 6
But – BAD they followed that up with one that makes superficial and false statements on the health impacts of wind turbines. She says there is no link between wind turbine noise and health effects — based on ERT conclusions. She does not say that it is next to impossible to win an ERT appeal on health. She said that noise impacts are controlled through setbacks and noise limits in the REAs.
What of the over 4500 records of health/noise complaints filed by people living near turbines in Ontario with the government since 2006? And the out-of-compliance turbines. This is important as if the local turbines are built, they may not be noise compliant. Slide 7 Bad-Turbines have been out of noise compliance with poor-to-totally lacking government response:
Port Elgin has one (Unifor) turbine – and have been complaining for years about the noise. Finally MOECC said that noise testing did show that it was out of compliance. A noise abatement protocol has to be put in place. The engineering report was filed with the MOECC in January, and then to the wrong Municipality in March – and finally to those affected. There is to be repeat testing in June–if it is out of compliance again -then what? Unknown.
Complaints regarding the Huron-Bruce Turbines in K2 Wind power project led to noise testing a year ago. Turbines were found to be out of compliance with Ontario regulations (April 2017). Since then, MOECC has done nothing.
Kincardine area has made multiple noise complaints over years, have been told testing is ongoing, but somehow, the tests are never completed, and the problem continues. In December they were told by MOECC that nothing was being done. And MOECC will not respond to complaints during an audit. The audit process started in December 2011 and is still not complete.
Slide 8
Last summer, a Brinston area resident wrote to Minister Murray about the complete lack of response to her reports of excessive noise (she has had to sleep in her basement on occasion because of the noise and vibration). An officer telephoned her and said:
Ministry staff were completely unprepared for wind turbine noise complaints.
They still don’t really know what to do.
They “lost” her records — even though she had so many reports that the MOECC actually installed equipment and did noise measurement for several days.
Last, it was too bad they lost everything pertaining to her situation and reports but it didn’t really matter, she was told because “You’re the only one complaining.”
With thousands of noise complaints recorded with the government unresolved, MOECC still refuse to acknowledge the problem, and refuses to look for causes.
Slide 10
Good: The MOECC finally admitted previous guidelines resulted in underestimating the noise at nearby homes – the modelling used to predict these impacts was wrong.
Last April 21, MOECC released a new protocol intended for “assessing noise from wind turbines that have already been built. It is used by industry and ministry staff to monitor compliance.” And compliance documents are to be publically available.
The result of non-compliance is: 1 – Remodel turbines; 2 – conduct a receptor audit at worst affected receptor from that turbine –or mitigation is required
Slide 9 Bad: However:
Still no recognition of low frequency noise. And, it hasn’t resulted in any effective changes.
Still – when WCO complained about the lack of response regarding noise and lack of a posted compliance report, they were told that the report cannot be posted as the turbine company’s documents are incomplete. (The turbines had been running for 3 years)
Slide 11
Although the government knows the modeling done by wind companies is wrong, they are allowing 5 new large-scale wind projects to follow the old guidelines. If they followed the new guidelines, about 3/4 of these turbines would have to be relocated or removed as they are predicted to be out of compliance with the new noise guidelines. At one project 11 of 12 would be out of compliance.
So in January, 5 affected communities filed a JR application against MOECC as surely, Ontario regulations and directives that limit the amount of noise any residence in the province should have to be followed. The claim is – transition provisions were put in place by the ministry to allow those wind turbine companies to use the old regulations without having to provide evidence that they were unable to comply with the new noise modelling guidelines (Dutton Dunwich, North Stormont, La Nation, and Wallaceburg)
Slide 12 Brilliant:
Wind Concerns Ontario taking Minister Murray to court May 18 for violating the Environmental Protection Act for permitting noise that causes adverse health events. According to WCO Access to information requests, of 4500 complaints noise/sleeplessness and other health-related effects received, few were followed up – only ~7% in 2015-16.
Slide 13 Ugly
In SW Ontario, in an area with sedimentary rock similar to that here, during and after IWT construction, well contamination has been reported – such that some wells are completely clogged, some failed simultaneously from pile-driving during construction. Some have not used their well for 4 years.
Before and after tests sent to Laboratories in Michigan show an exponential increase [in] turbidity among the affected wells, including [a] large proportion that can be attributed to black shale particles that are known to contain heavy metals, including uranium, arsenic and lead.
An ERT had warned that water wells in that area could be damaged.
A professional geologist said: the relationship between the installation of wind turbines and the contamination of wells is obvious. When you have a [pure] water source for years and [transforms] a few days after the construction of an industrial facility. You do not have to be a genius to see that there is a link of cause and effect.
He had agreement from geoscientist and geological engineer.
The project’s owner claims it has nothing to do with the problem.
MOECC’s response — While there’s been an admission that wells have indeed been contaminated, contamination can only be attributed to “unidentified factors.” They maintain that pile-driving activities associated with wind turbine development are not to blame. This conclusion was based on evaluations prepared by the power developer’s consultant.
MOECC say that you should only test your water for bacteria.
Quinte Region Proposed Source Protection Plan Version 8.1 Aug 2012: Section 2.4: “Due to the shallow soil conditions, the entire Quinte area was identified and mapped as a highly vulnerable aquifer. This designation was a direct result of the ease with which a contaminant can move into the underlying fractured bedrock aquifer.”
Slide 14
In 2017 alone, reported in the media:
181 accidents.* Note that there is massive underreporting. RenewableUK confirmed that of 1500 wind turbine accidents and incidents in the UK alone between 2006 and 2011, only 9% are on the global report. So there may have been more like 1800 accidents.
But it gives information on a cross-section of accidents: –
Of the 181, there were 17 fatal accidents, 13 injury accidents, 16 blade failure (blade or partial blade throws, travelling up to 1 mile), 24 fires, 14 structural failures (storm damage, tower collapse), 19 transport – related (biggest cause of public injury/fatalities, e.g. ram through a house, turbine parts falling off).
Slide 15
Turbine collapse in Chatham-Kent January
And in Germany, bits of blade travelled over 500 m –yes, the distance to neighbouring houses by Ontario regulations.
Slide 16 CONCLUSION
MOECC, MNRF – Apparently – still blind, deaf and dumb regarding turbine effects and violations
All rules and regulations can be broken for the precious GEA
Compliance is only met only if citizens fight (and pay) for it
Feds (Health Canada, Environment Canada) – no better
Energy consumption is a driver of economic growth. Policymakers in Ontario have made poor policy decisions, resulting in rising electricity costs, lower employment, and lower competitiveness, while achieving minimal environmental benefits. This publication presents a series of collected essays that critique the reasoning behind Ontario’s electricity policy changes and spell out the long term consequences.
Ontario’s main policy shift began around 2005 when the government made a decision to begin phasing out coal. The next major step occurred in 2009 when the government launched its Green Energy Act (GEA). The centerpiece of the GEA was a Feed-In-Tariff program, which provides long-term guaranteed contracts to generators with renewable sources (wind, solar, etc.) at a fixed price above market rates. In order to fund these commitments, as well as the cost of conservation programs, Ontario levied a non-market surcharge on electricity called the Global Adjustment (GA). Between 2008 and 2016, the GA grew more than 70 percent, causing a drastic increase in electricity prices. The high cost associated with aggressively promoting renewable sources is particularly troubling given the relatively small amount of electricity generated by these sources. In 2016, renewable sources generated less than 7 percent of electricity in Ontario while accounting for almost 30 percent of the GA.
Ontario’s decision to phase out coal contributed to rising electricity costs in the province, a decision justified at the time with claims that it would yield large environmental and health benefits. The subsequent research showed that shuttering these power plants had very little effect on air pollution. Had the province simply continued with retrofits to the coal plants then underway, the environmental benefits of the shift to renewables could have been achieved at one-tenth the cost.
The issue of rising electricity costs in Ontario can be partly attributed to the imbalances between supply and demand of electricity. Between 2005 and 2015, the province decided to increase its renewable capacity to facilitate the coal phase-out. However, since renewable sources are not as reliable as traditional sources, the government contracted for more natural gas capacity as a back-up. Meanwhile, the demand for electricity declined, partly due to rising electricity costs. The increase in the total installed capacity, coupled with lower electricity demand, has resulted in excess production being exported to other jurisdiction at a significant loss.
As a result of these structural shifts and poor governance, electricity costs have risen substantially in Ontario. Ontario now has the fastest growing electricity costs in the country and among the highest in North America. Between 2008 and 2016, Ontario’s residential electricity costs increased by 71 percent, far outpacing the 34 percent average growth in electricity prices across Canada. In 2016, Toronto residents paid $60 more per month than the average Canadian for electricity.
Ontario’s skyrocketing electricity rates also apply to the province’s industrial sector. Between 2010 and 2016, large industrial users in Toronto and Ottawa experienced cost spikes of 53 percent and 46 percent, respectively, while the average increase in electric costs for the rest of Canada was only 14 percent. In 2016, large industrial users paid almost three times more than consumers in Montreal and Calgary and almost twice the prices paid by large consumers in Vancouver. Some select large industrial consumers were granted rate reductions but still paid higher rates compared to large electricity users in Quebec, Alberta, and British Columbia.
Soaring electricity costs in Ontario have placed a significant financial burden on the manufacturing sector and hampered its competitiveness. Compared to multiple comparable American and Canadian jurisdictions, Ontario has exhibited the most substantial decline in its manufacturing sector over the past decade. Overall, Ontario’s high electricity prices are responsible for approximately 75,000 job losses in the manufacturing sector from 2008 to 2015.
Given the critically important role that affordable energy plays in economic growth and prosperity, the authors urge the Ontario government to pursue meaningful policy reforms aimed at lowering electricity costs for all Ontarians.
Authors:
Elmira Aliakbari;Kenneth P. Green;Ross McKitrick;Ashley Stedman
My wife and I live south of 72, in Hopkinton. We are totally against the North Ridge Wind Project and the expansion south of 72.
Do I feel the wind law is strict enough? No, but there has already been enough compromises on our part.
Time after time the majority of residents have voiced they are against this project.
And, yes, we all know what we signed and do know what a PILOT is, so please stop insulting our intelligence and insinuating that these signatures are not legal residents.
I commend the three women on Hopkinton town board for wisely listening to the majority of your constituents and the Wind Advisory Boards recommendations.
Unfortunately, I question if the two men on the board have drank the Kool-Aid.
One’s dad is a lease holder so ethically must recuse himself and the other being Hopkinton’s fire chief and Avangrid publically stating thousands of dollars ear marked for the fire district, appears he may have some ethically questionable motives and perhaps he should also recuse himself.
A no brainer: Guaranteed 100 percent assessment. If you own a shack or a mansion — we each pay the same assessment. This company has a lot more money than any of us and if this is such a good financial deal for our town, lets guarantee that by making them be fair to each of us.
Pay your full 100% assessment like we all do!
When all is said and done and Avangrid has packed their bags and “gone with the wind,” we will still be here. We have thrived for over 200 years and will continue to thrive.
As our elected town representatives: Will you be able to hold your head high knowing you took your position to represent and protect the majority of the towns people in the highest regards?
Canada Pension Plan’s investment in part of a wind-solar power portfolio seems to ignore a lot of negatives, including the energy poverty rising in Ontario due to electricity bills
Canada Pension Plan contribution rates are rising again, as reported by the Financial Post December 14, 2017: “the contribution rate (i.e., the CPP tax) has increased from 3.6 per cent when the CPP was launched in 1966 to its current rate of 9.9 per cent. It will increase further to 11.9 per cent beginning in 2019.”
The Canada Pension Plan Investment Board (CPPIB) is an active investor, looking for good rates of return without taking “excessive risk.” So they either searched for assets that pay guaranteed above market rates, or were approached by U.S. Power giant NextEra who sold them their Ontario portfolio of 396 MW of wind and solar contracts. CPPIB paid $1.871 million per MW for a total of $741 million CAD and also assumed the debt (US$689 million) attached to the NextEra portfolio. The press release associated with the acquisition had this quote from Bruce Hogg, Managing Director, Head of Power and Renewables: “As power demand grows worldwide and with a focus on accelerating the energy transition, we will continue to seek opportunities to expand our power and renewables portfolio globally.”
Perhaps Mr. Hogg was unaware “power demand” in Ontario has actually fallen from 153.4 TWh in 2004 to 132.1 TWh in 2017 despite an increase in our population of approximately 450,000. He may also be unaware industrial wind turbines create health problems, cause property values to drop and kill birds and bats including those on the endangered species list.
What the CPP acquisition means is Ontario ratepayers will be indirectly contributing additional funds to the CPP without the benefit of reducing either their annual tax burden or increasing their future pension benefits. A “win, win” for CPP and a “lose, lose” for Ontario’s taxpayers. The sole redeeming feature is that the money will stay in Canada instead of flowing elsewhere.
Ironically, the CPP by acquiring and holding those assets will also be showing their support for energy poverty. The Ontario Energy Board (OEB) in their December 2014 report noted: “Using LIM* as a measuring tool, and relying on Statistics Canada household data, Ontario has 713,300 low-income households.” At that point in time the 713,300 households represented almost 16% of residential ratepayers in the province and one should suspect that number has increased over the past three years.
So, one should also wonder why NextEra, headquartered in Florida, sold those assets and their above market returns? The press related to their announcement of the sale speaks volumes: “As discussed during our earnings call in January, we expect the sale of the Canadian portfolio to enable us to recycle capital back into U.S. assets, which benefit from a longer federal income tax shield and a lower effective corporate tax rate, allowing NextEra Energy Partners to retain more CAFD** in the future for every $1 invested.”
No doubt the NextEra sale may be a sign of the future as the Canadian economy has shown serious signs of slowing as taxes rise and foreign investment falls. The bulk of the investment in the renewable energy sector in Ontario came from offshore companies who rushed to take advantage of the above market rates and guaranteed prices offered under the Feed-in-Tariff (FIT) program available under the Green Energy Act.
Those investors will look to cash in on the sale of those assets, so we should expect to see more public and private Canadian pension funds stepping up to purchase them.
Parker Gallant
*Statistics Canada’s Low-Income Measure is simply defined as half of the median adjusted economic family income.

 Dear Mr. Ford,


 The following is from a presentation by Anne Dumbrille, Chair of CCSAGE at the Annual General Meeting held at Bloomfield Town Hall, Saturday, May 5, 2018
 Letter to Editor published April 6, 2018|