
The Cost Of Generating Electricity in Ontario
A key question at the top of my Hydro One electricity statement is “What am I paying for?” According to Hydro One the charge includes:
1) The cost of generating the electricity used – ‘the Ontario Energy Board (OEB) sets the cost and the money collected goes directly to the electricity generators.’
2) The delivery – ‘money collected by Hydro One to build, maintain, and operate the electrical infrastructure which includes power lines, steel towers, and wood poles covering 960,000 sq km’
3) Regulatory charges – the Independent Electricity System Operator (IESO) uses this money to manage electricity supply and demand in the province.
4) HST – harmonized sales tax
5) 8% Provincial Rebate.
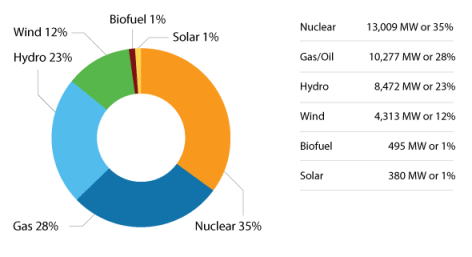
In Ontario we can generate power from three nuclear power plants, 45 hydro generating stations, 30 gas plants, 38 industrial wind turbine installations, 5 solar installations and 5 biofuel generating stations. The website gridwatch.ca provides an hourly overview of power generated, Ontario demand and imports and exports.
The Cost of Electricity Generation in Ontario –
| GENERATOR
TYPE |
UNIT COST/ MWh (1) | OUTPUT / HR
(2) |
OUTPUT / DAY | COST / DAY | COST / YEAR (3)
+ constrained Power |
| HYDRO | $ 62.00 /
MWh |
3143 MW /hr | 75,442
MWh / day |
$ 4,677,379
/ day |
$ 1,707.243
Million / year |
| NUCLEAR | $ 77.00 /
MWh |
7551.5 MW/hr | 181,236.6
MWh / day |
$13,955,218
/ day |
$ 5,093.66
Million / year |
| WIND | $ 159.00 /
MWh |
765 MW / hr | 18,353
MWh / day |
$ 2,918,057
/ day |
$ 1,065.09
Million / year |
| NATURAL GAS | $ 188.00 / MWh | 489 MW / hr | 11,736
MWh / day |
$ 2,206,368
/ day |
$ 805.324
Million / year |
| SOLAR | $ 513.00 /
MWh |
45 MW / hr | 1086
MWh / day |
$ 556,872
/ day |
$ 203.258
Million / year |
| BIO FUELS | $ 236.00 /
MWh |
37 MW / hr | 884 MWh /
day |
$ 208,718
/ day |
$ 76.182
Million / year |
| 12,030.5 MW
/ hr |
$24,522,612
/ day |
(1) Total Electricity Supply Costs Source:Power Advisory p.16 https://www.oeb.ca/sites/default/files/RPP-Supply-Cost-Report-20180501-20190430-correction.pdf
(2) IESO Generator Output by Fuel Type Monthly Report 2017
http://reports.ieso.ca/public/GenOutputbyFuelMonthly/PUB_GenOutputbyFuelMonthly_2017_v12.xml
(3) Cost per Year is for power produced so payment for constrained power must be added to the cost.
According to the IESO we have a total installed capacity of 36,853 MW of power that could be produced per hour if all generators were running flat out. To allow for maintenance and emergencies the IESO forecasts capability at peak demand rather than using total installed capacity. The forecast capability at peak demand for Ontario is 26,704 MW/hr, which is the production of power generation we count on.
The demand for power fluctuates with time of day, day of the week, weather conditions, and season. In 2017 the average hourly demand for power was 12,031 MW per hour. Therefore, we have tremendous capacity in the Ontario power system.
It is further complicated because not all generators are equal – nuclear, hydro and gas are reliable baseload generators that can be ramped up or down. But wind and solar are unreliable, intermittent and only produce power when the wind blows and the sun shines.
To accommodate a fluctuating supply considerable flexibility exists in the system. We pay for production, but we also pay for generation that is constrained or held back from the grid. Some generators are underutilized, and we pay them to sit idle and provide backup.
Using the information provided by the Independent Electricity Systems Operator (IESO):
The least expensive power Ontario generates is HYDRO. Our cleanest, greenest, cheapest renewable energy costs $62.00 per MWh. The Ontario Hydro power generating system has a total installed capacity of 8480 MW per hour potential production, with a capability at peak demand of 5786 MW / hr. On average the output from the Hydro generating system for 2017 was 3143 MW/hr. Although we only used 54% of the capability of Ontario hydro generation plants (the rest of the time we ran the water over the dam) Hydro provided 26% of our hourly generation of power in Ontario in 2017. The Hydro supplied to the electrical grid cost $1.707 billion dollars in 2017.
The second least expensive power generated in Ontario is NUCLEAR which cost $77.00 per MWh. Nuclear is the work horse for Ontario providing more than 63% of the power produced in this province. The average hourly output for 2017 was 7551 MW per hour. Costing $5.093 billion dollars per year.
Ninety percent of the power produced in Ontario is from Hydro and Nuclear and we underutilize both these systems to accommodate wind and solar energy. The daily cost for Hydro and Nuclear power produced is $18.6 million dollars per day or $6.8 billion dollars per year.
The total unit cost for WIND power is $159.00 per MWh produced (two and one-half times the cost of hydro and double the cost of nuclear). Wind has an installed name plate capacity of 4213 MW/hr but is an intermittent and unreliable energy source and only provided 765 MW per hour or 6% of the hourly generation of power for Ontario in 2017. Using the installed capacity wind energy should be providing 35% of the power production of this province, but due to the unreliable nature of wind the production could be 0% so nineteen gas plants were built since 2003 to back up wind and solar. The daily cost of wind energy that was produced was $2.9 million dollars per day or $1.065 billion dollars per year. This does not include the amount paid for constrained wind energy so under-represents the actual cost.
If we add in the cost of constrained wind which was 3.396 million MWh in 2017 and pay that out at $120.00 per MWh then the cost increase for constrained wind in 2017 was $407.5 million. The total cost of wind energy for 2017 then is closer to $1,065 + 407.5 = $1,472.5 million dollars or $1.4725 billion dollars per year.
The total unit cost for NATURAL GAS is $188.00 per MWh produced. Because natural gas is used as a back-up power for wind and solar the demand fluctuates hourly and again we have an energy source that is also paid when constrained. The gas plants are capable of producing 10,277 MW/ hr but only produced 489 MW/ hr in 2017. So we operated the gas plants at 5% of their potential! The daily cost of natural gas energy that was produced was $2.2 million per day or $ 805 million per year plus cost for constrained natural gas.
Constrained natural gas is paid $10,000.00 per month per potential MWh of production. So with a potential production of 10,277 MWh X $10,000 X 12 = $1,233,240,000 per year. The total for natural gas would be closer to $2,038.24 million dollars per year or $2.038 billion dollars.
The elephant in the room is definitely SOLAR weighing in at $513.00 per MWh produced (eight times the cost of hydro!) The contribution of roughly 1000 MWh per day is minimal but the cost is phenomenal at just over $0.5 million per day. A cost of $203 million per year. Again, we have not accounted for the huge amount of solar energy that is embedded in the local distribution systems eg small solar installations and panels mounted on your house. So the cost of solar is grossly under-represented, probably to keep us in the dark.
If the embedded solar is indeed 2,300 MW of installed capacity (using 13% as the potential production) we have an additional 299 MW/hr solar to pay for. At $513.00 per MWh that would be an additional 299 X 24 hr per day X $513 = $3.693 million per day or $1.348 billion dollars per year. So, the total cost of solar could be closer to $1.551 billion per year. ($1.348 +$0.203)
Only 10% of our power is produced from wind, solar and natural gas, made possible by underutilizing our nuclear and hydro power generation. The total cost for wind energy in 2017 was upwards of $1.4725 billion dollars plus solar at $1.551 billion dollars plus natural gas at $2.038 billion dollars for a total of $5.062 billion dollars!
That final 10% of the power generated in Ontario is probably costing us closer to $5 billion dollars – over 40% of the total cost of the generation of electricity in this province! And we still need to include the cost of the delivery charges, the regulatory charges and the HST!! Waste, waste and more government waste as we pay for duplication, underutilization and huge government subsidies for the generation of power in Ontario.
Catherine Mitchell – a concerned citizen

One thought on ““What am I Paying for?””